October 1, 2019
September 2019 has been a great month for us. We officially launched our website and started to move our work away from individual twitter accounts (e.g. @charliejhadley) and have started building our brand1 with @rfindingyourway.
Let’s recap some of the things we’ve learned this month and seen in the #rstats community.
- Bring all
library("foobar")calls to the top with{packup} - Use prefix notation for infix operators with ``
- Interactively build
{ggplot2}charts with{equisse} - spreads()’s dead in
{tidyr} v1.0 - Mara Averick brings good game to explaining
hoist()with GIF
Tidy up loading pkgs with {packup}
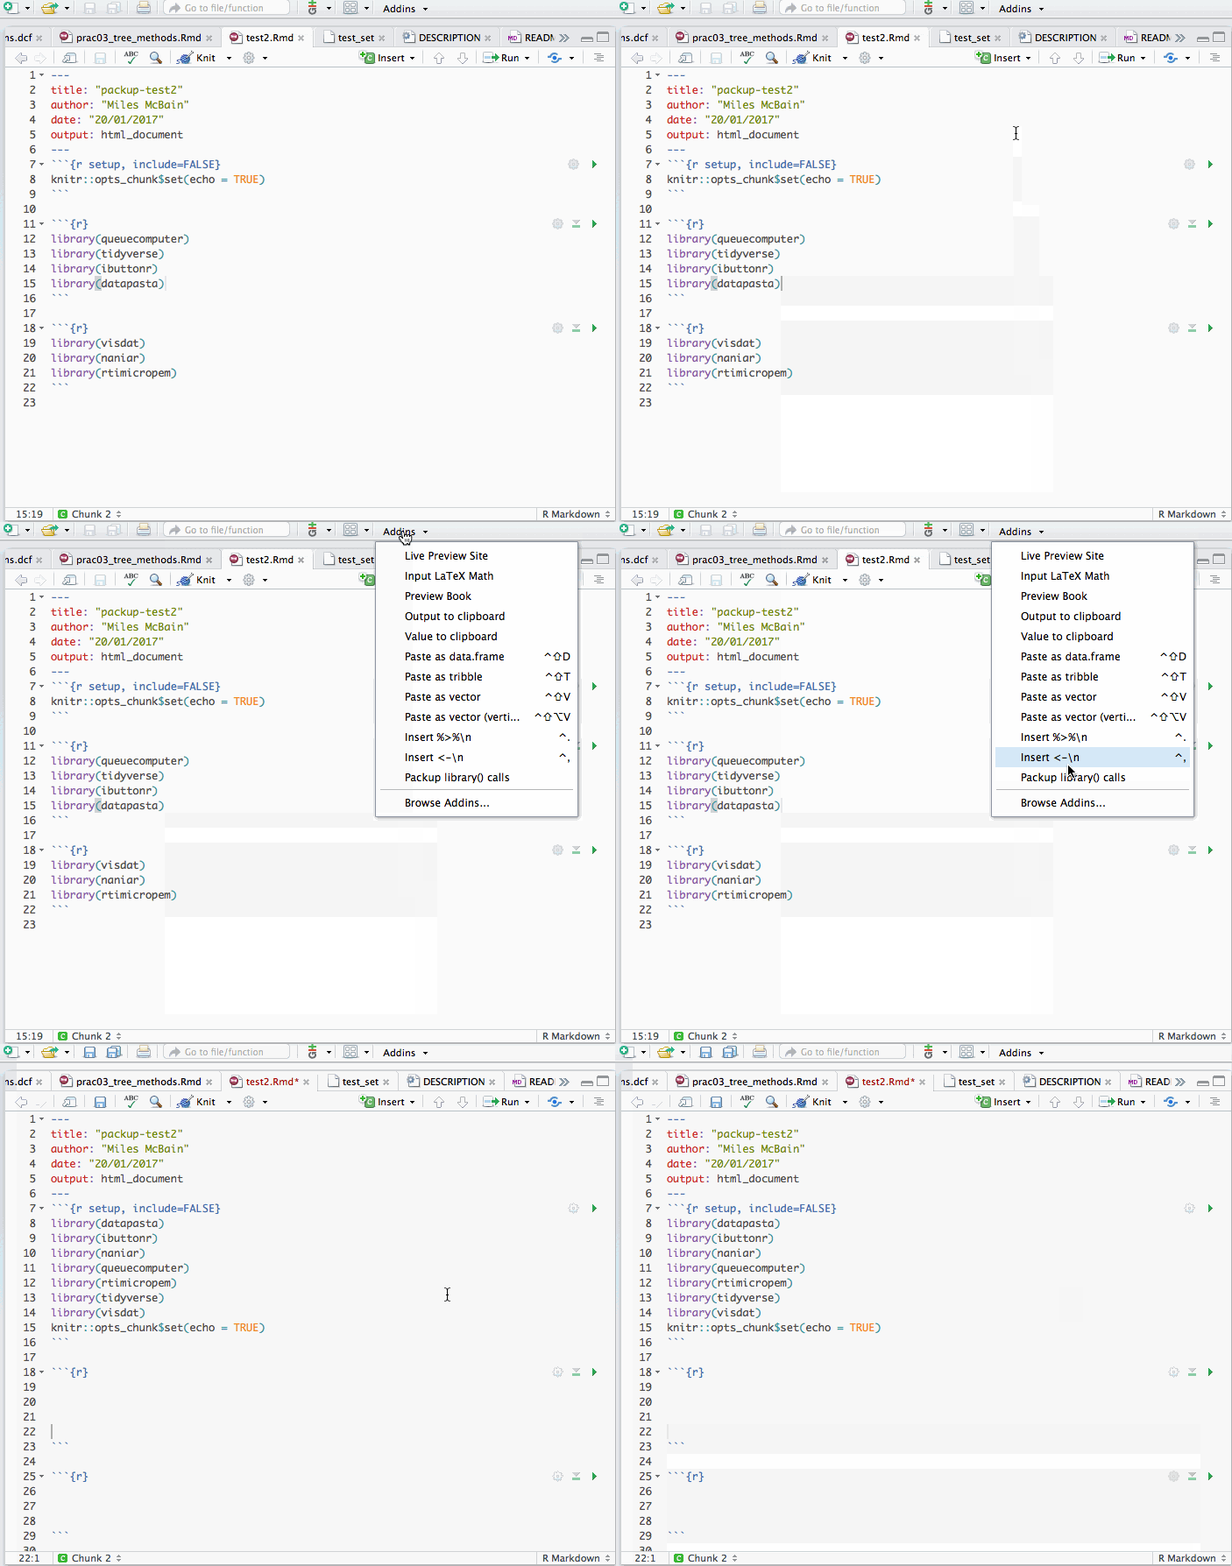
One of our daily tweets reminded folks to load packages at the top of scripts, and we implied also at the top of RMarkdown documents. We were delighted to discover @MilesMcBain’s {packup} package which contains an RStudio add-in to automate moving library("pkg") to the top of RMarkdown documents!
Always load packages at the top of your #rstats scripts.
— finding youR way (@rfindingyourway) September 9, 2019
It's extremely important that your scripts don't have a “special order” in which code is run, a user should be able to open your script and get it to work with these two steps:
- ⌘+A / Ctrl+A
- ⌘+Enter / Ctrl+Enter

Prefix notation with ``
We discovered that the dplyr::add_tally() function includes a really nice example of prefixed infix operators… so nice in fact that we tweeted about it and wrote a blogpost about it.
ggplot2 GUI with {equisse}
On our training courses we’re often asked about a GUI for building {ggplot2} charts. Before September our answer was always “we don’t know about one”.
Now we recommend the excellent {esquisse} package, see dreamrs.github.io/esquisse/ for more details.
Using the GUI comes with a disclaimer. Hadley Wickham has a great slide deck on why data science can’t be done in a GUI, which is why we’d always learning the fundamentals of {ggplot2} so you can iterate away from the boilerplate dataviz that {equisse} allows you to create.

spread()’s dead, baby, spread()’s dead
gather() and spread() have been retired as the workhorses of {tidyr} with the release of v1.0 in favour of the more expressive and versatile pivot_longer() and pivot_wider(), respectively.
We ended up with writing a short dedicated blogpost on this topic, which includes a summary of our Twitter poll on the subject with 196 responses.
hoist() animations from @dataanadme
The release of {tidyr} v1.0 brings many new features to the tidyverse for working with nested tibbles - which is affectionately called rectangling. These rectangling functions are fairly complex, and often the simplest way to explain them is with a GIF.
We particularly enjoyed the hoist() animated GIF from Mara Averick, and hope to see more function demos in the near future!
🤖
— Mara Averick (@dataandme) September 30, 2019tidyr::hoist()robot-arm edition…
data %>% hoist(info,
name = “name”,
firstborn = list(“children”, 1L)
)
* the latter portion aptly named “the rumplestiltskin” by @hadleywickham
docs: https://t.co/Es91thelAX gist: https://t.co/Ho5IRPoNQy #rstats pic.twitter.com/vrG8simf9z
It might feel gross talking about a training consultancty as a brand, but it is. We deliver both online courses and in-person training, that’s how we earn our bread and butter. Folks trust those that others trust, which is why we are committed to sharing our knowledge and promoting the work of others in the community - for the benefit of all useRs.↩︎

